Research
Check out my google scholar or search for me on NASA/ADS for the most up-to-date links to papers and abstracts. Please feel to email me if you cannot access the articles through your institution.
On-going work
Shape and Mutual Orbit Modeling of Equal-Mass Binary Near-Earth Asteroid System 2017 YE5 from Radar Observations
with Dr. Flaviane Venditti and Dr. Sean Marshall, Florida Space Institute
2017 YE5 is one of four known near-earth equal-mass binary asteroids, and has many radar and photometry observations which can be used to determine the orbital and physical characteristics of this system. Previous work suggests that 2017 YE5 may be a dormant Jupiter-family comet due to its dark red color and it’s orbit. Delay-doppler radar observations from Arecibo and Goldstone Observatories allows us to create a shape model for both components of this system, solve for the rotational poles, rotational and orbital period of each component, and determine the size of the bodies.
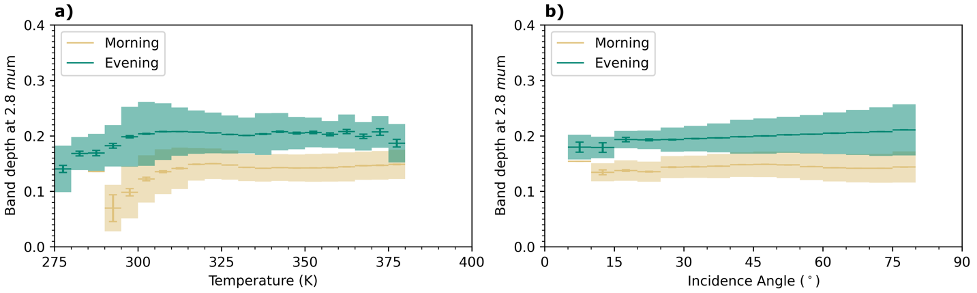
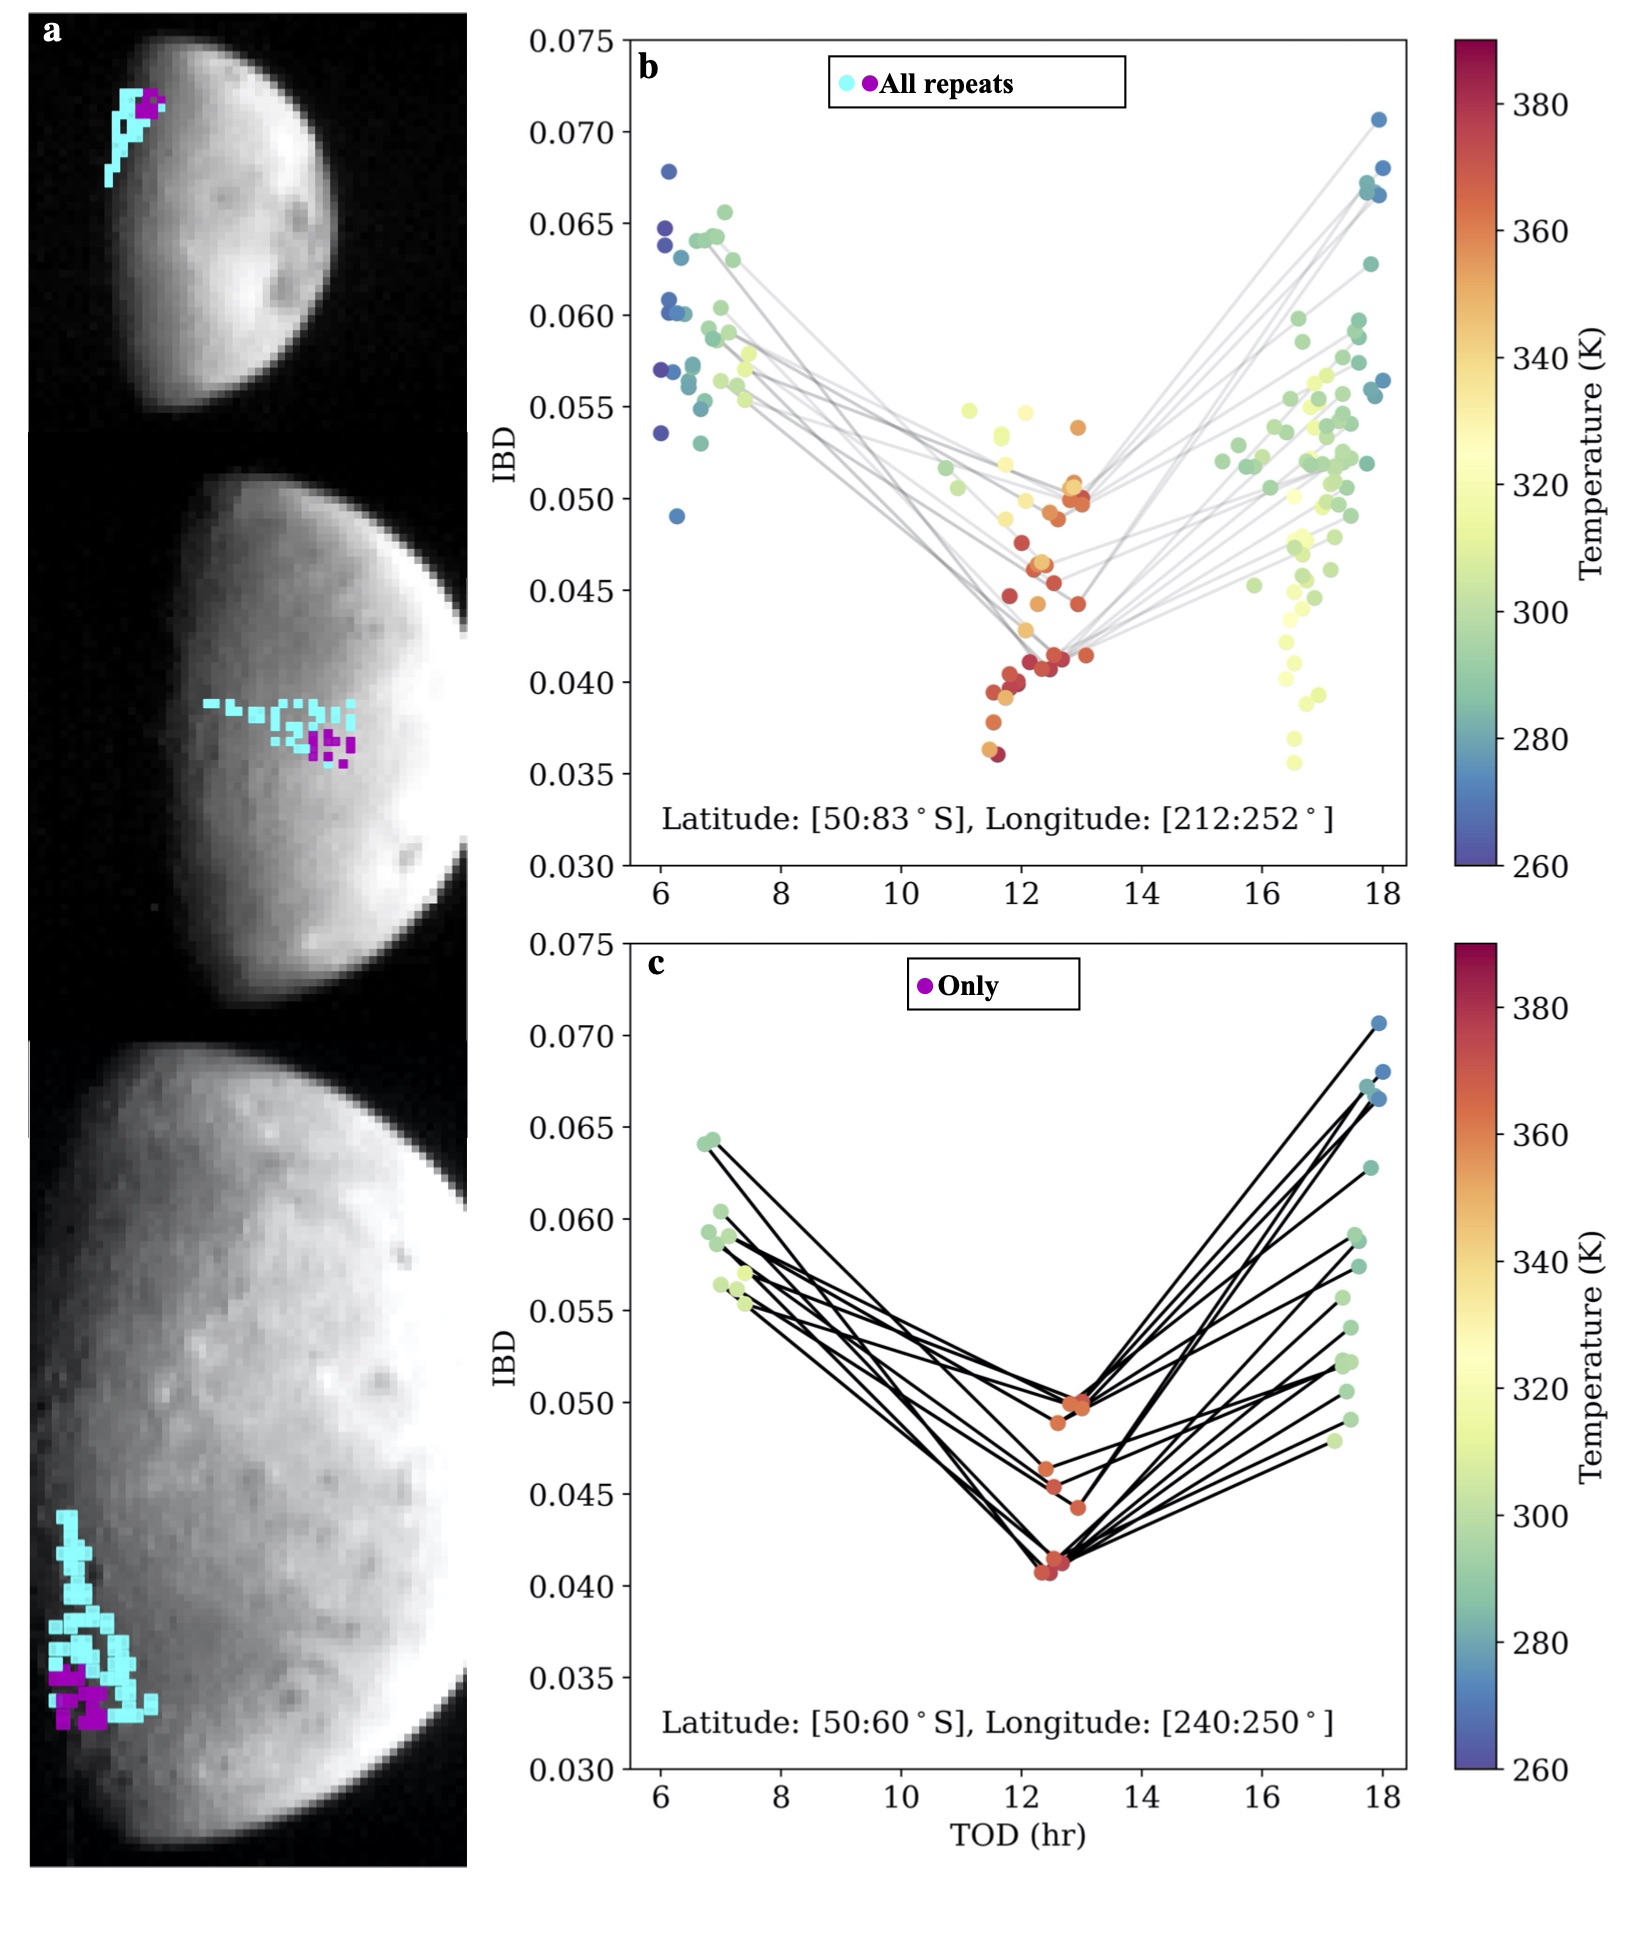
Exploring trends in lunar hydration as tied to surface illumination using the Imaging Infrared Spectrometer aboard Chandrayaan-2
with Dr. Ali Bramson, Purdue University
Recent observations by Chandrayaan-2’s infrared spectrometer (IIRS) provides a way to explore small scale variations of the 3µm OH/H2O hydration feature, focusing on how the variability relates to lighting conditions, instateneous surface temperature, and local time of day. The IIRS instrument covers the entire 3µm region and includes out to 5µm, allowing for direct removal of the thermal component of the spectra, using the method published in Laferriere et al. (2022). Preliminary results suggest that the diurnal variability is symmetric around local noon, as the morning observations (shown below, yellow) have overall lower abundance than evening observations which are closer to the terminator (2 lunar hours vs 1 hour).
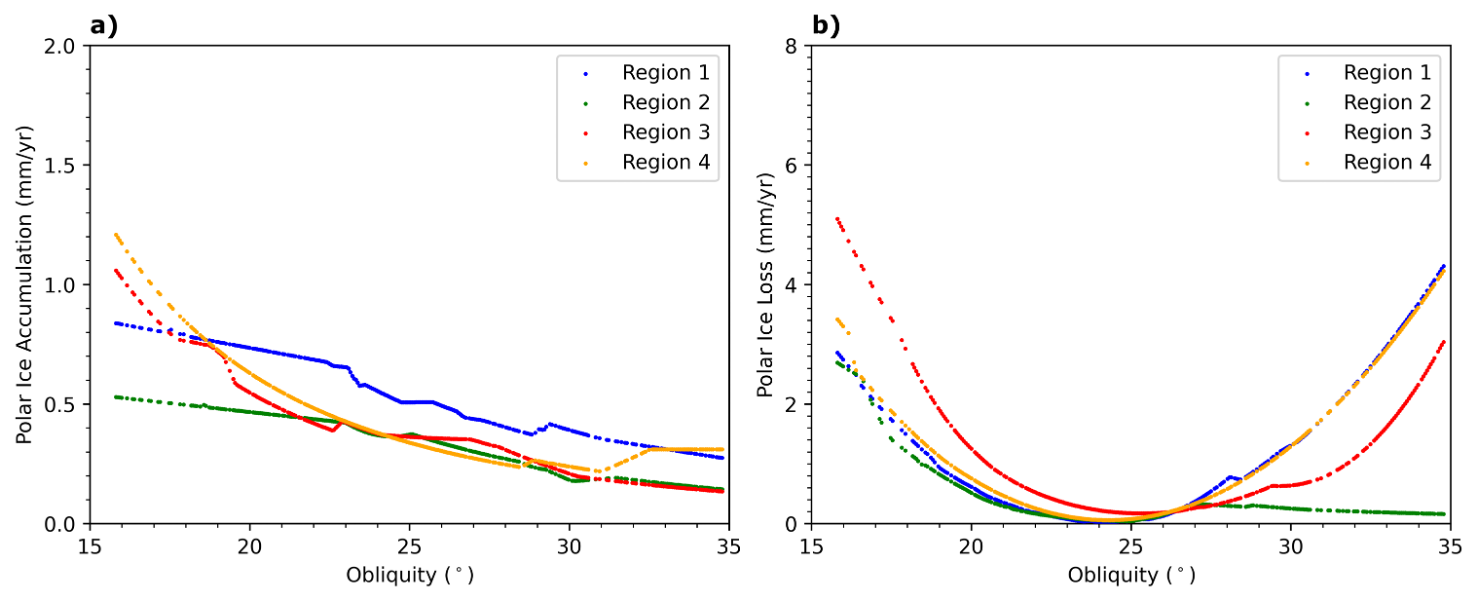
Modeling Ice Mass Balance using MCMC and Trough Migration Paths
with Dr. Ali Bramson, Purdue University
Mars’ northern pole features a kilometers-thick ice cap of mostly pure water ice, and most of this polar cap is made up of the North Polar Layered Deposits (NPLD). The NPLD is a series of continous layers of ice and dust. The variation in dust content allows for observation of these layers through ground penetrating radar, like SHARAD aboard MRO. These layers provide a record of variations in Mars’ climate due to orbital forcing. Shown below is an example of a TMP and best fit model determined from this approach, and the accumulation and ice retreat rate through time as recorded in this subsurface feature. In the upper ~500 meters of the NPLD are sloping unconformities, which have been interpreted as bounding surfaces due to the migration of the spiral troughs poleward over time. We used a MCMC approach combined with a phenomenological model to back out Mars’ ice accumulation and loss rates through time based on the mapped trough migration paths. Overall, we find that ice accumulation decreases with increasing obliquity (expected), and ice loss is bimodal with obliquity (less expected).
In Review
Past Projects
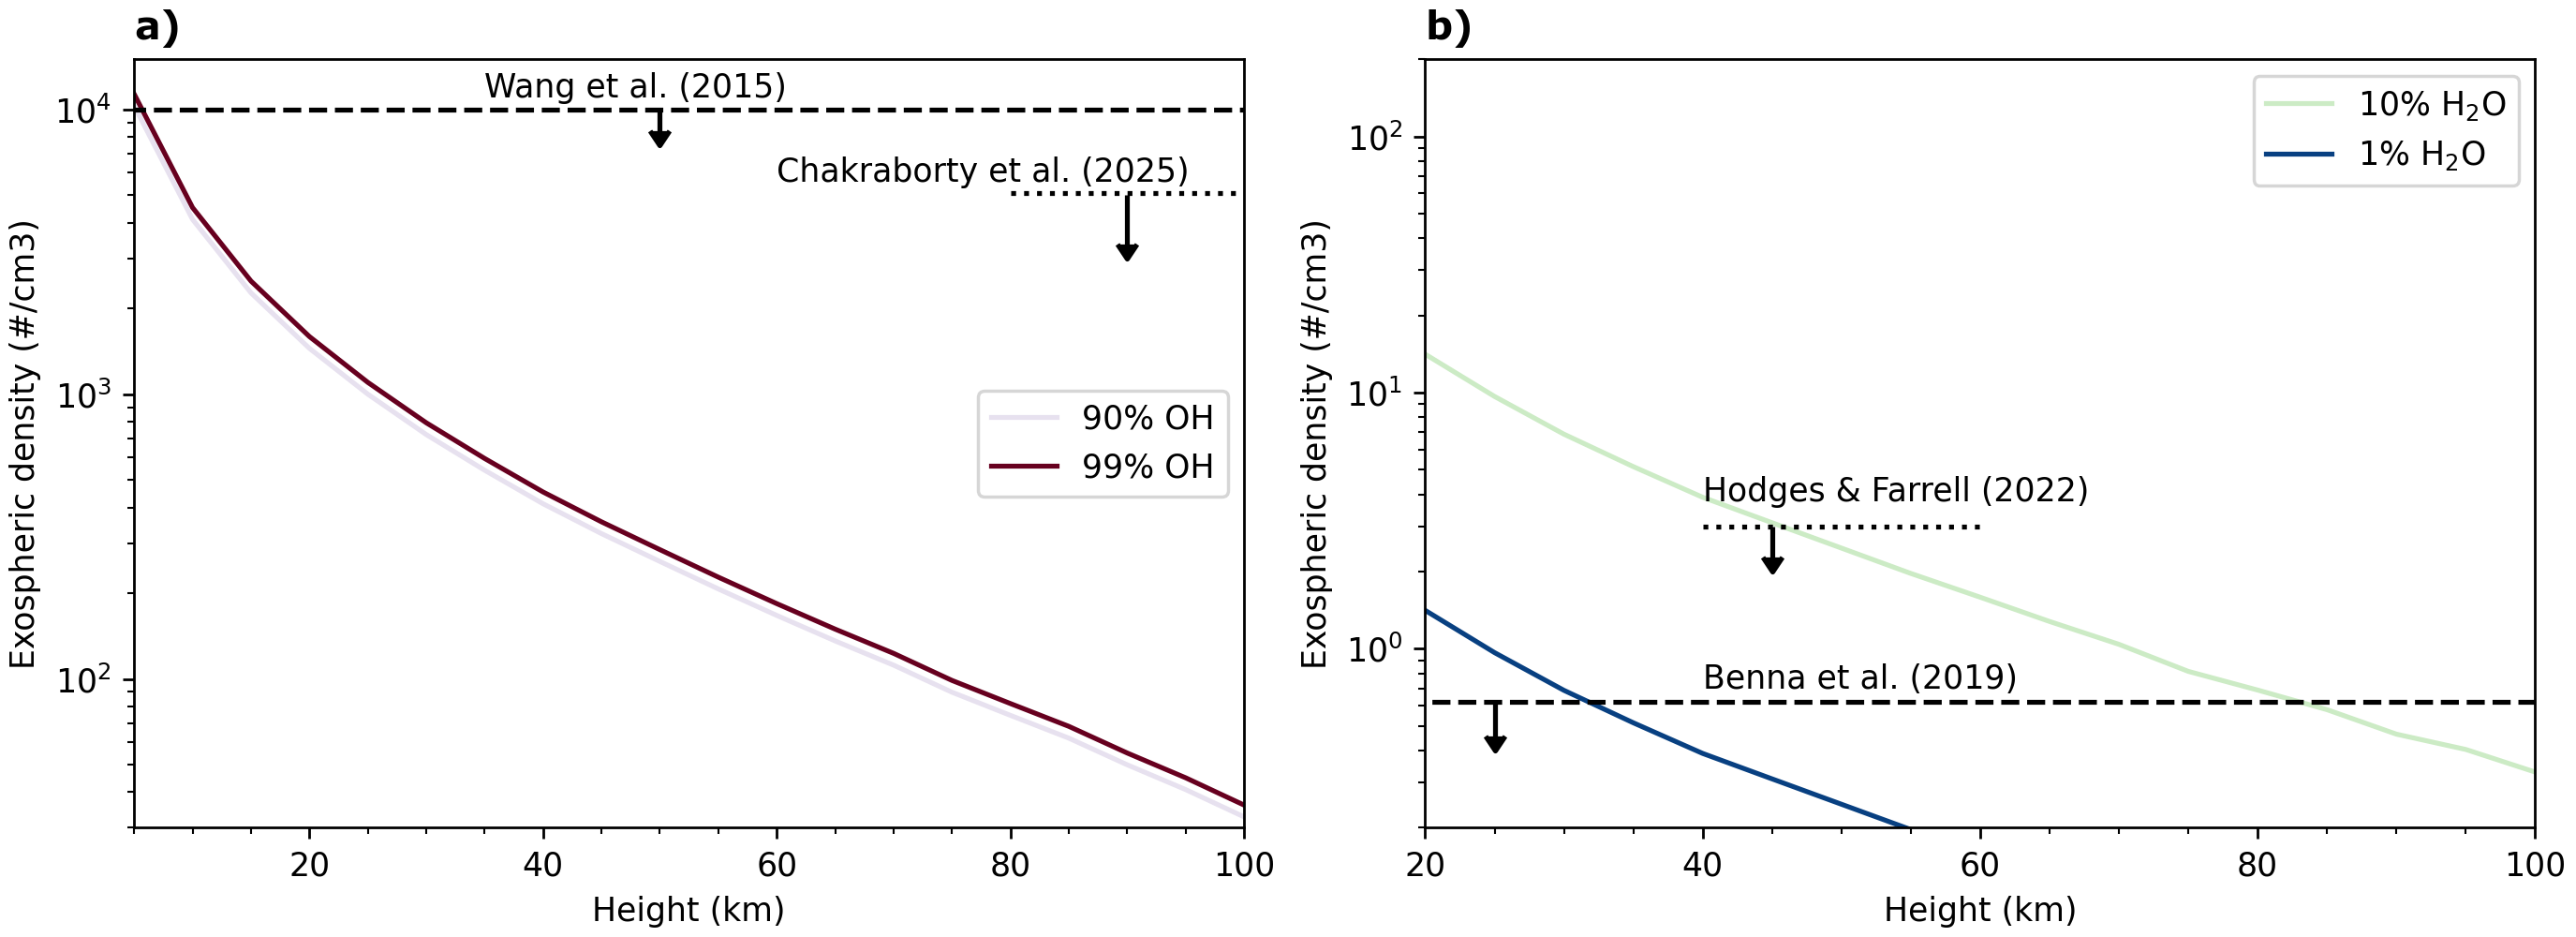
Quantities of Ballistically Hopping Water Molecules on the Moon: Consistent With Exospheric Hydration Observations
with Dr. Ali Bramson, Purdue University
Published in JGR: Planets (2025)
The mechanism which results in the observed diurnal varaibility of the 3 micron absorption feature is unknown. One potential mechanism that has been proposed is ballistic migration, however it has been suggested that measurements of the lunar exosphere disagree with this hypothesis. We explore if both the diurnal trends observed on the surface and the exopsheric density can be explained through ballistic transport. Shown below is the result of our OH and H2O models, revealing that ballistic transport produces similar exospheric densities to those observed.
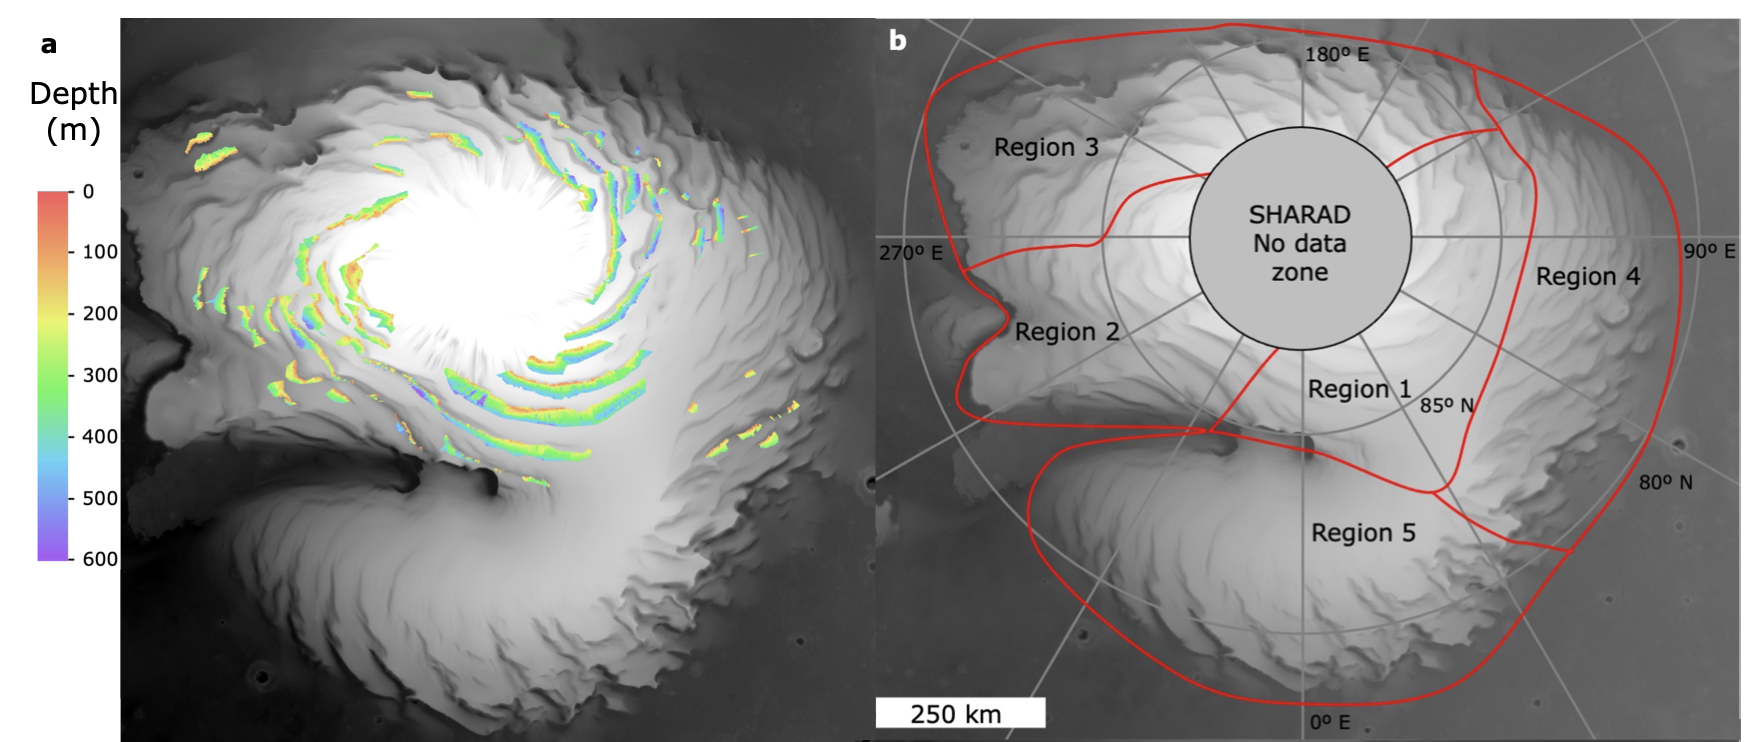
Mars’ North Polar Spiral Trough Migration Paths as revealed through 3D Radar Mapping
with Dr. Ali Bramson, Purdue University
Published in JGR: Planets (2024)
We have extensively mapped radar features known as “Trough Migration paths” throughout the recent SHARAD 3D dataset (link), characterizing the morphologies of these features which act as a tracer for Mars’ volatile mass balance over the past few million years. Shown below is our map of TMPs (color is depth from above surface) and the regions categorized by surface and subsurface radar features.
Exploring the variability of the 3 micron hydration feature across the southern hemisphere of the Moon
With Dr. Jessica Sunshine and Dr. Lori Feaga, University of Maryland, College Park
Published in JGR: Planets (2022)
The 3µm OH/H2O hydration feature on the Moon has been observed using various instruments. The 2009 Deep Impact spacecraft flyby present a unique view of the southern hemisphere, allowing for exploration of the feature spatially and temporally using near infrared spectroscopy. The HRI-IR spectrometer aboard Deep Impact includes out to 4.85 micrometers, which allowed for removal of the thermal component of the spectra through modeling of a scatter and thermal spectra component. This allows us to investigate the entire 3 micron absorption feature and the variability in strength and shape across the southern hemisphere.
As there were three fly-by observations, we also have a small region of repeat coverage spanning half of a lunar day. This allows for investigation into diurnal variation of the same physical region.
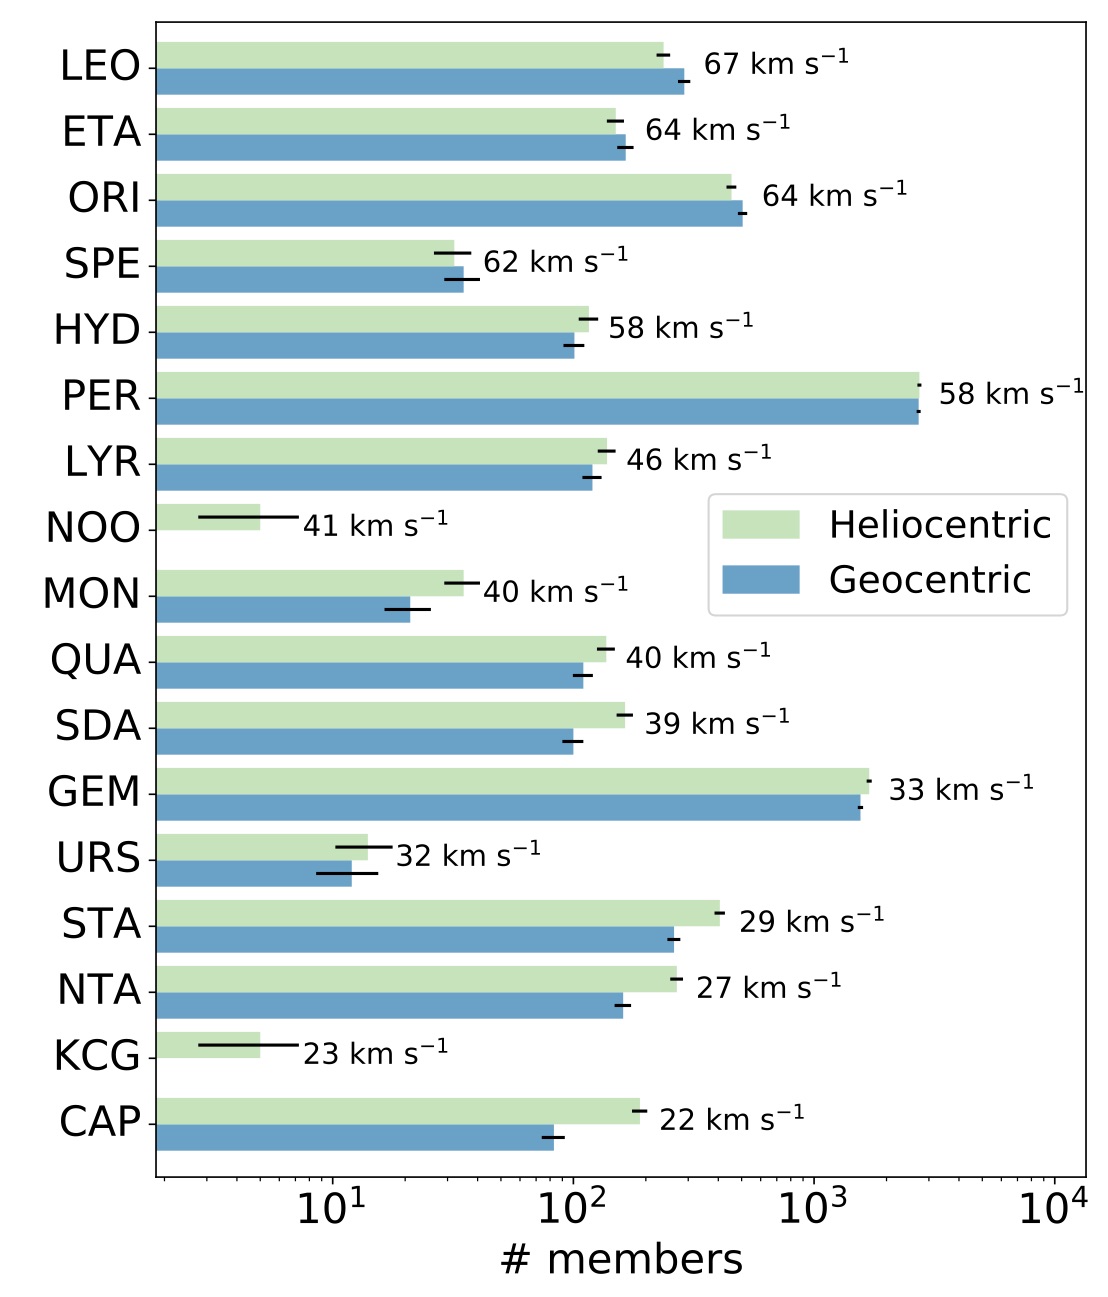
Survey of low speed meteor showers
with Dr. Althea Moorhead, Marshall Space Flight Center, Meteoroid Enviornment Office
Proper shower assossiation of meteors observed expands our ability to predict and forecast future shower fluxes. Slow meteors often are difficult to associate with showers due to their geometry upon collision with Earth’s atmosphere, so we attempted to associate meteors to showers from their helocentric radiant, rather than the geocentric radiant they are observed in. We found that the use of heliocentric radiant associates more medium to slow speed meteors to known showers than the geocentric radiant. Using a density based spatial clustering algorithm with noise (DBSCAN), we organized metoers into showers given speed, direction (radiant), and time of occurance. Shown below is a bar chart containing the number of members associated to each shower given our two approachs, heliocentric and geocentric. Note that the x-axis is logarithmic.