LPSC 2025
Thank you for scanning my qr code!
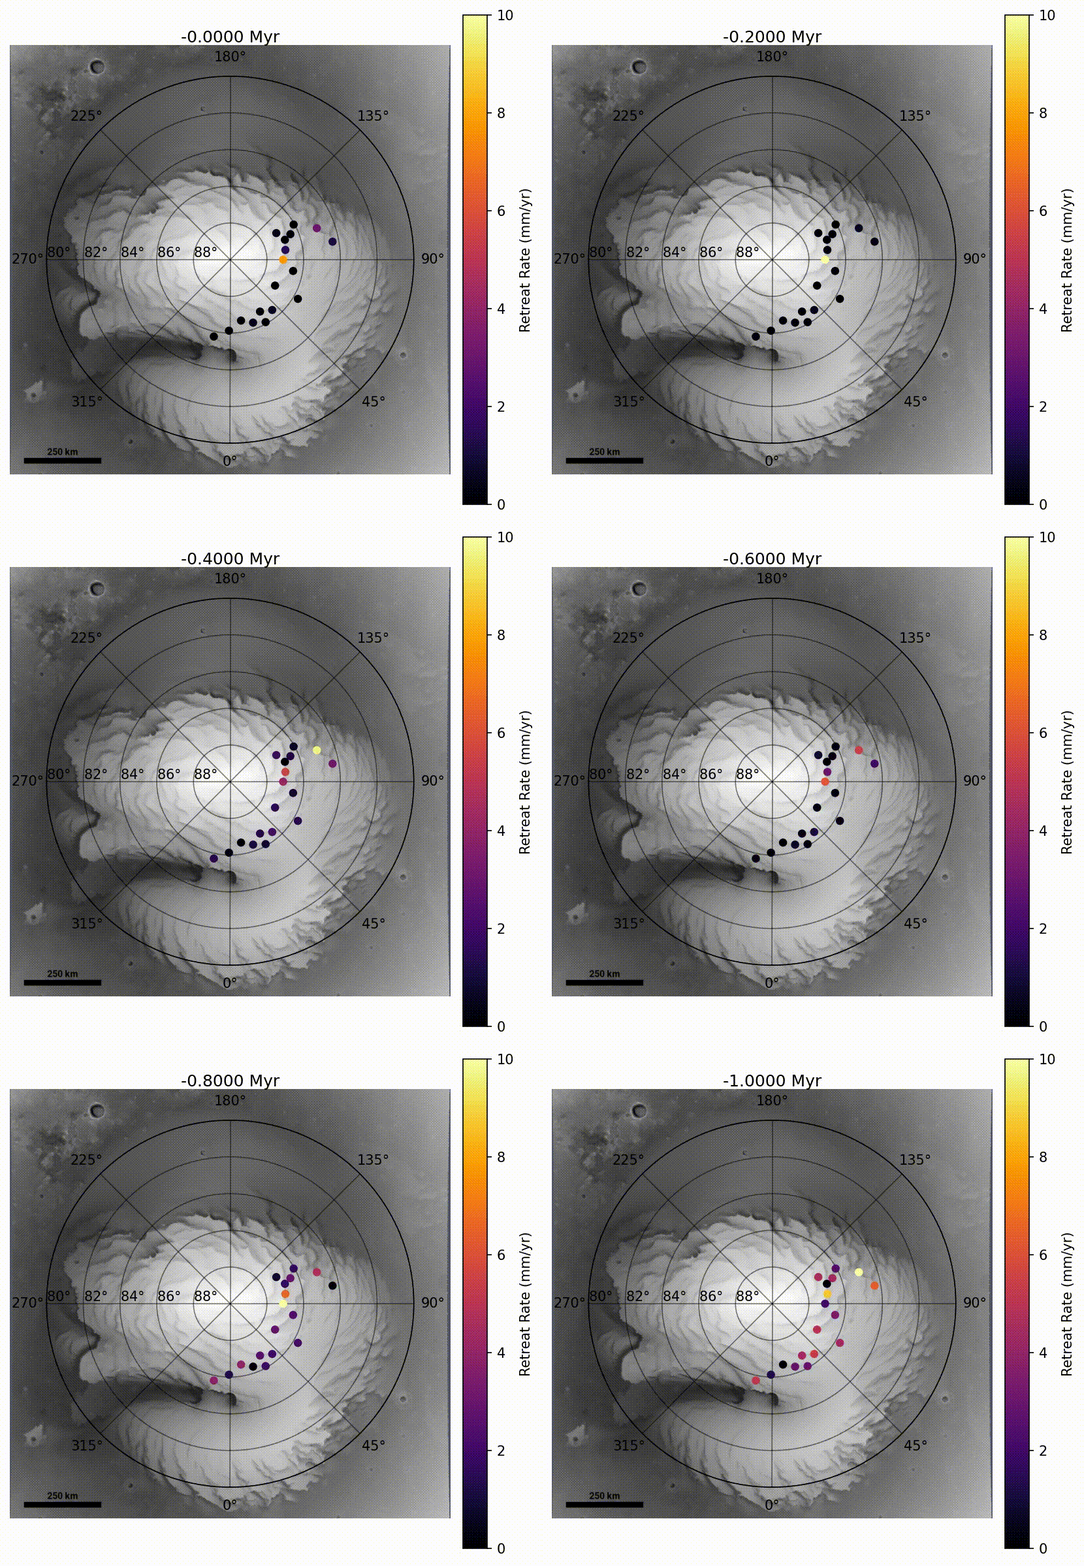
First, you can see the ice retreat rates at each slice in Region 1 as determined from the best fit model result for the last 1 Myrs.

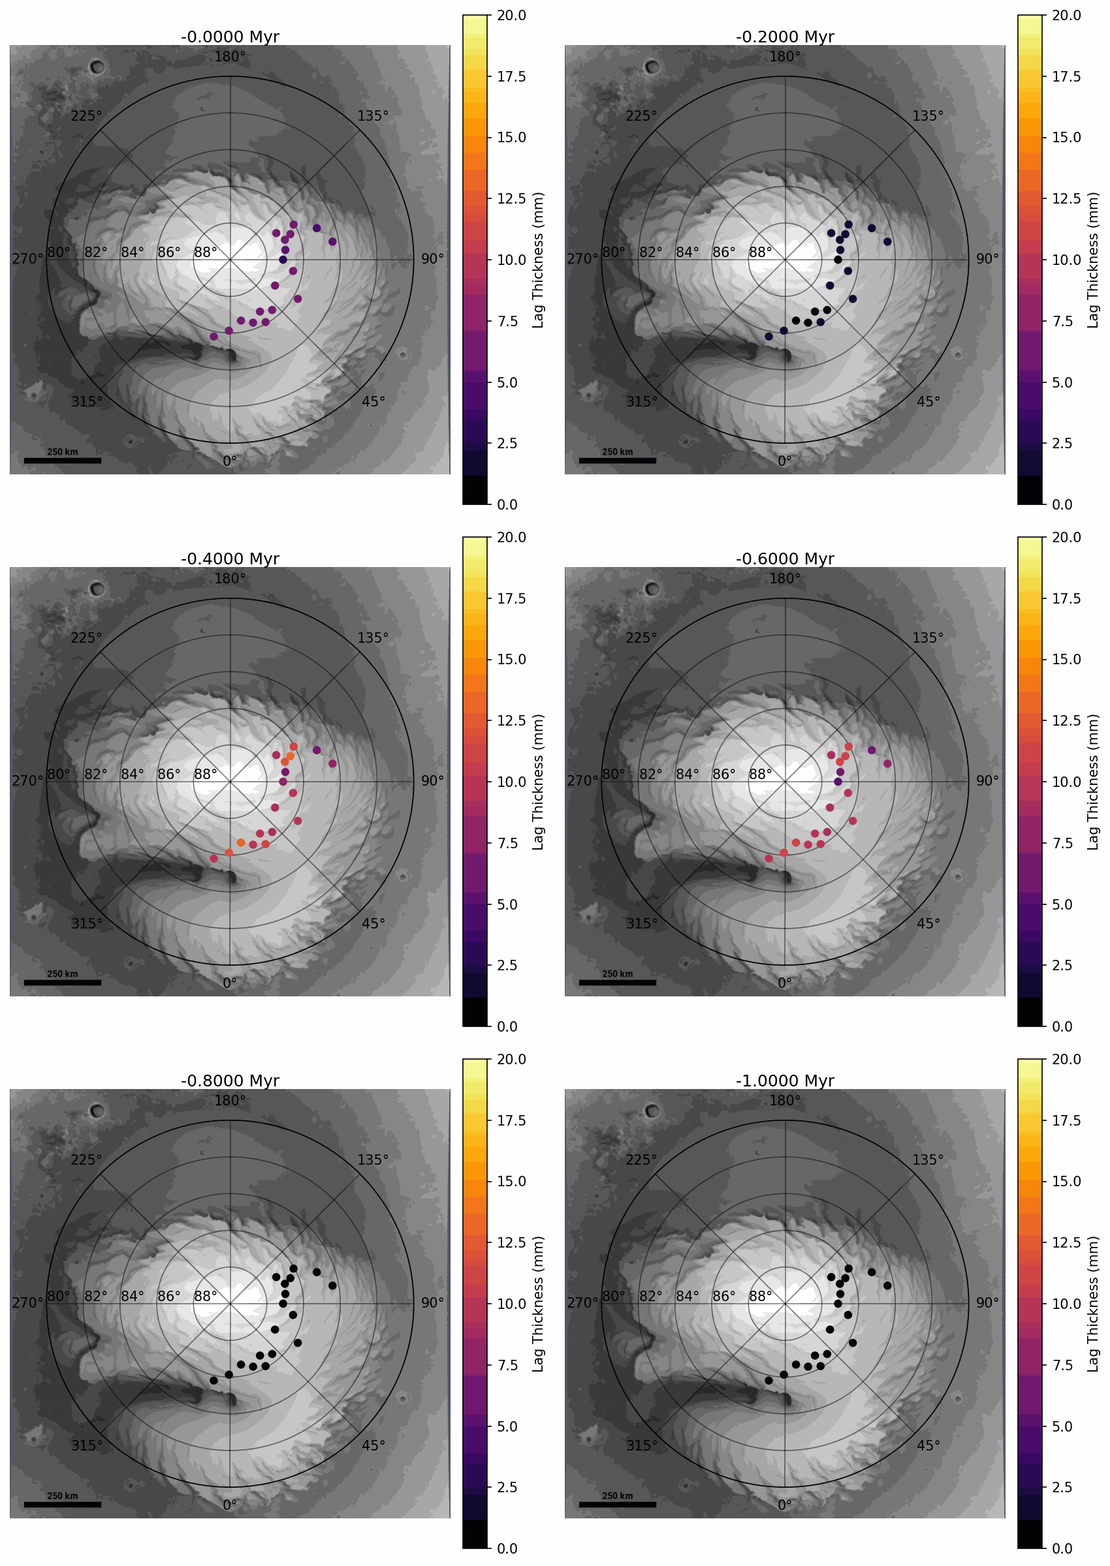
Using our 1D thermal model (modified from Bramson et al. 2017 and Bramson et al. 2019), we can interpret the thickness of an insulating lag layer using these ice retreat rates (see below).

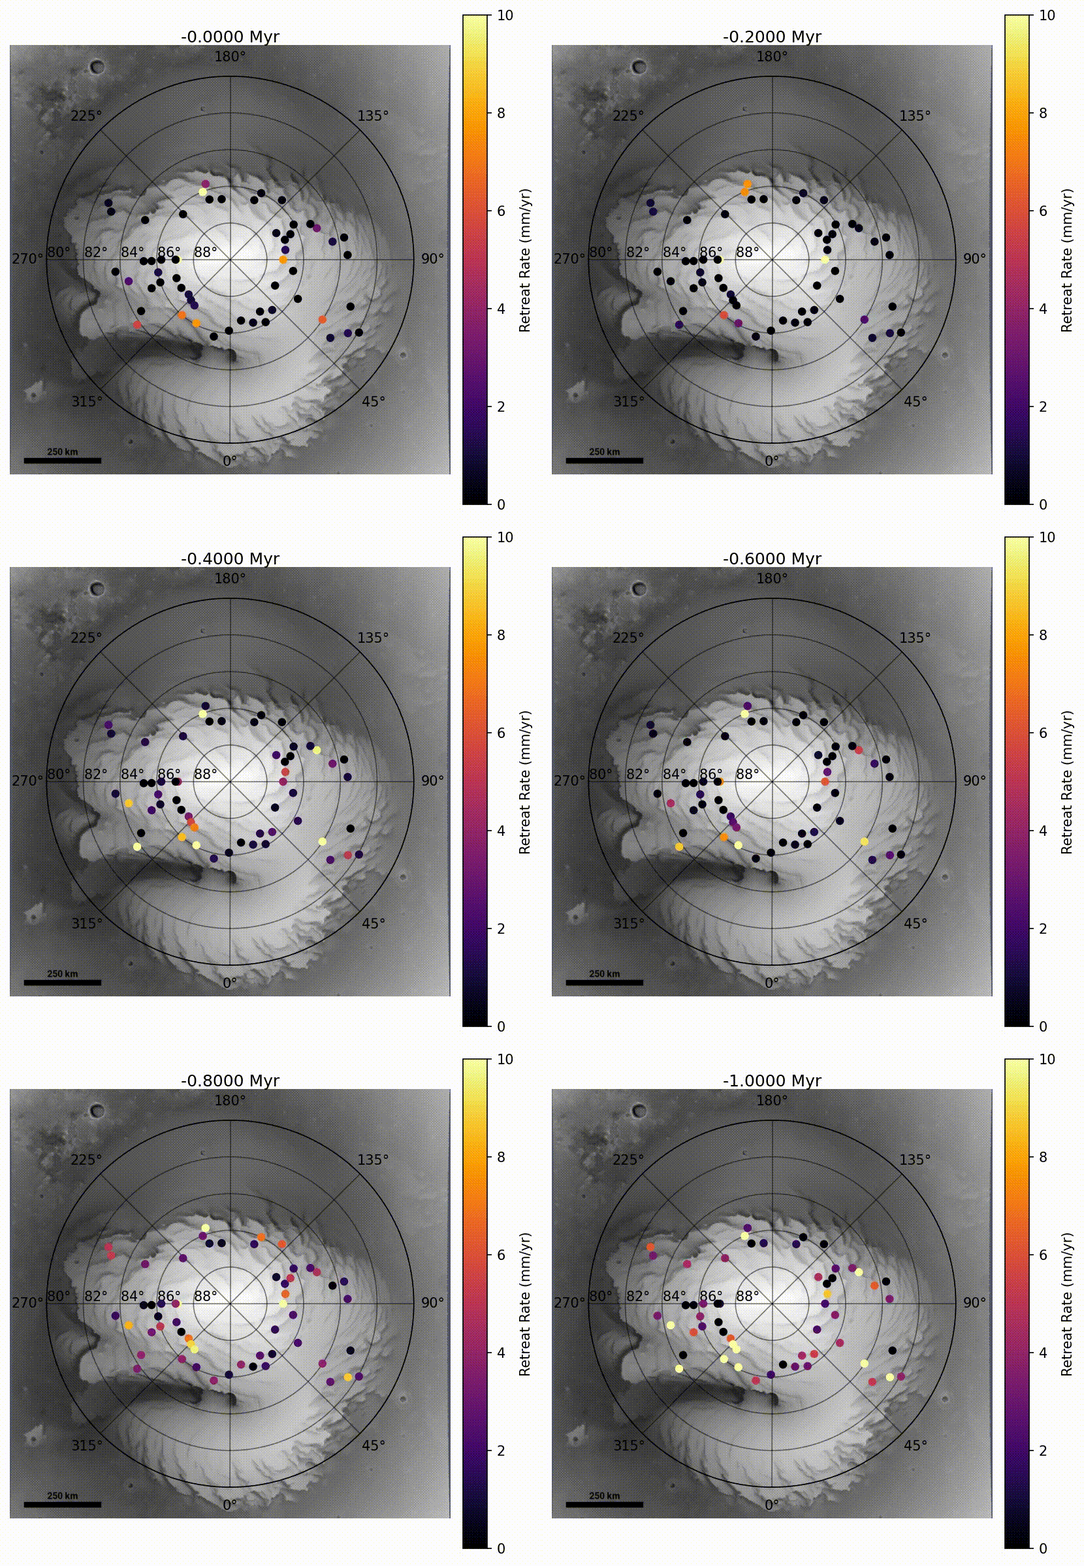
We also have the ice retreat rates across the polar cap for the past 1 Myrs.

The 1D thermal model lag thickness results for the entire cap is still in progress!